LogCheck
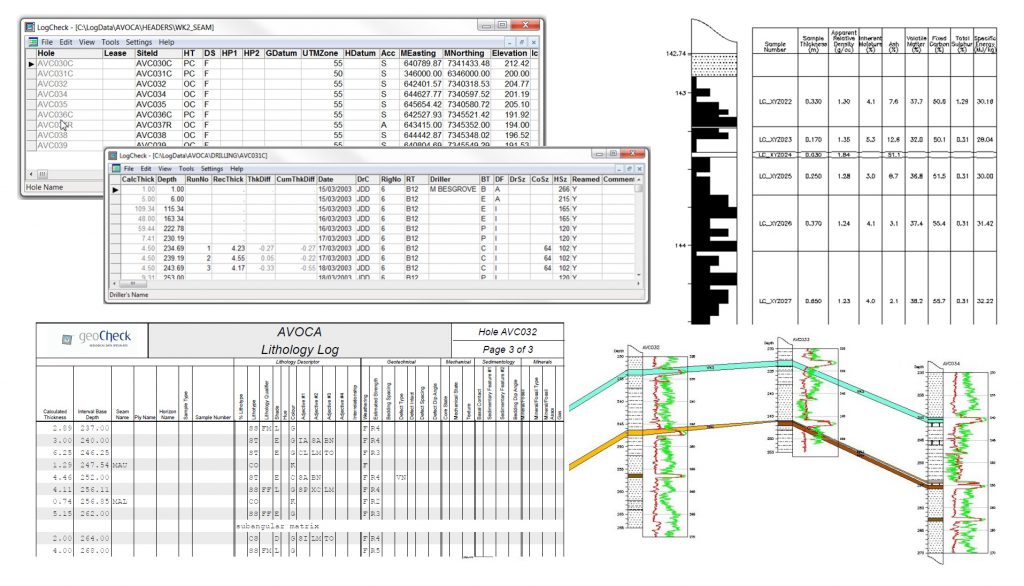
LogCheck is a Windows based software system for the management of coal exploration data. It includes facilities for:
- data entry, validation, plotting and production of English reports for hole header (location information), drilling, water flow, downhole geological and geotechnical (rock mass unit, defect and point load) data,
- plotting and geological log depth adjustment using downhole geophysical data,
- import and export of dictionaries and data to and from geological databases and modelling packages, such as Acquire, Geobank, MineScape (GDB), Vulcan, Minex and Englog,
- production of various audits and summaries, including summaries of: data currently stored for each hole; dictionary code usage; drilling meterage; seams, horizons and samples in each hole; contents of downhole geophysical (LAS) files; rock mass unit characteristics and point load indices.
- Compilation of detailed CQ data from various analytical bases into a linked database system that verifies the data entry, allows some manipulation of the coal data into composites over seams and then the export of this data for further modelling.
LASmanager
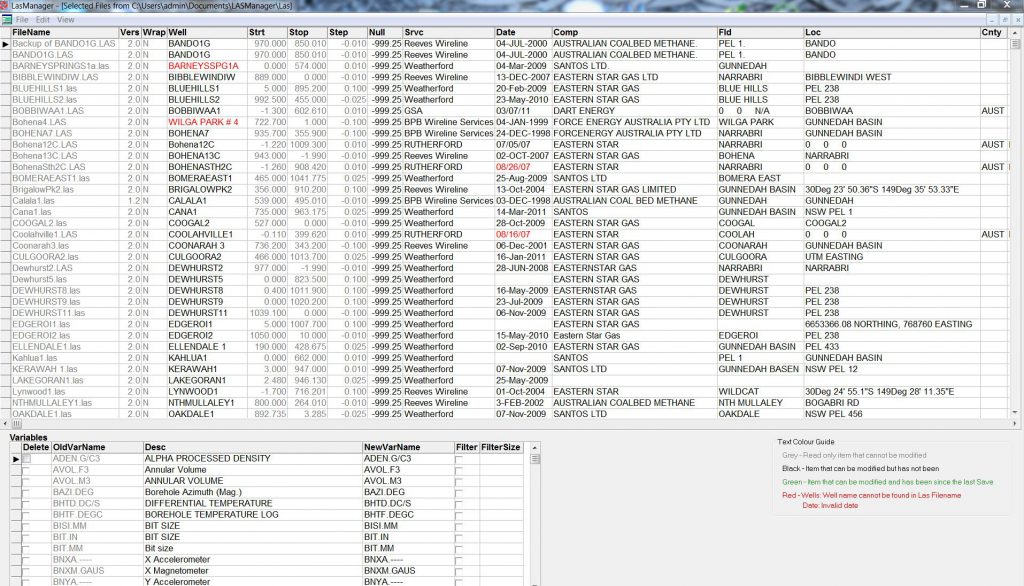
LASManager is small manipulation tool that has been developed to be able to make your Log ASCII Standard data consistent across a project or company system.
The software validates, audits, and can correct multiple LAS downhole geophysical files at once.